Excerpts from my Final paper, Masters Degree in Sustainable Transportation;
The Shape of Things To Come

The potential that autonomous vehicles (AVs) represent for disruptive and beneficial change calls for increased study and evaluation. Because of the speed at which relevant technologies are developing the time has come to look beyond short term impacts on safety, travel time reduction, accessibility and parking. History suggests that the present focus of debates over driverless vehicles-- liability, security, and popular acceptance -- are likely to be transitory. The significance of a mature autonomous transportation system will take longer to develop, but will have a profound impact on our social, economic, and built environments.
This study examines the potential for driverless vehicles to address travel demand generated by activities not usually associated with single-occupancy vehicles. The focus is on the potential for small, lightweight, automated vehicles (LAV’s) to perform transportation duties that are presently accomplished by larger, more polluting vehicles. The two roles examined are the use of smaller unmanned vehicles to distribute consumer items and for the collection of municipal solid waste (MSW) and recycling. Both examples attempt to look beyond our preconceptions about the size and shape of (especially commercial and municipal) vehicles and their role in today’s transportation system.

While the potential impact of driverless vehicles on traffic safety, congestion, and single occupancy vehicles use are increasingly studied (Hoogendoorn et al, 2014), the potential impact on transit and goods movement has received little attention. After decades of anticipation driverless vehicles have, in the space of a few years, moved from science fiction to a firm technological foundation. Enabling technologies are of proven functionality, and are rapidly increasing in capacity and diminishing in cost. Faster processors, smaller, cheaper, and longer range sensors, faster and more robust short range communications, all combine with ever more sophisticated computer algorithms to provide the basis for reliable autonomous vehicle navigation. The result is that autonomous vehicles are approaching the point of being able to operate within the limitations of the existing infrastructure, and may in the foreseeable future begin to play a role in the development of an entirely new transportation paradigm.
The question as to how exactly this innovation will find its way onto the roads in significant numbers is not the subject of this study. Almost every car company (Audi, BMW, Nissan, Mercedes, Ford, Toyota, GM, Volvo), original equipment manufacturer (Continental, Bosch), large technology companies (Google, Apple), and major university (Stanford, MIT, UW) is engaged in significant research and development programs related to driverless or components of driverless technology. Several states have legalized the testing of driverless vehicles on public roads. But the fact remains that very few people have seen a driverless vehicle on the road, and it is unlikely that significant numbers will be a passenger in one for many years to come.
But this change is coming. Historical examples of innovation suggest that significant changes in transportation infrastructures proceed slowly but, upon reaching a tipping point, proceed at a rapid pace. The combination of one of the oldest and most successful of man made technologies - the wheel - with the power of the computer will change the nature of the car, the road, and society. It is now time for sustainable transportation advocates to plan to take advantage of the potentials of driverless technology that will become apparent only after this initial period of transition.
Lightweight Automated Vehicle (LAV)
Vehicle Description
The LAV (Lightweight Automated Vehicle) represents one potential design that emerges as a result of removing the need for a driver in autonomous vehicles. The size and mass of a large motorcycle, capable of autonomous operation around the clock, it has the potential to transport goods (when used in significant numbers) on a scale that exceeds the capacity of much larger contemporary vehicles. Smaller and more closely tailored to particular tasks, such vehicles can potentially address urban needs such as small item delivery, recycling, and waste recovery. Other more specialized roles such as emergency response, disaster recovery, and even personal transportation are possible. The small size of such vehicles, generally under 500 pounds, would be a less imposing presence than conventionally sized driverless cars, and would therefore be more acceptable in an urban context.
“They can become much lighter--the design freedom that will come
about from removing the normal (operator/driver) considerations is
going to create a lot of synergies in a lot of different areas.”
- University of Michigan Transportation Research
Institute director Peter Sweatman
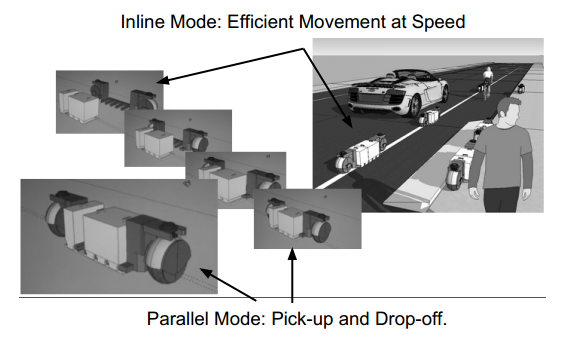
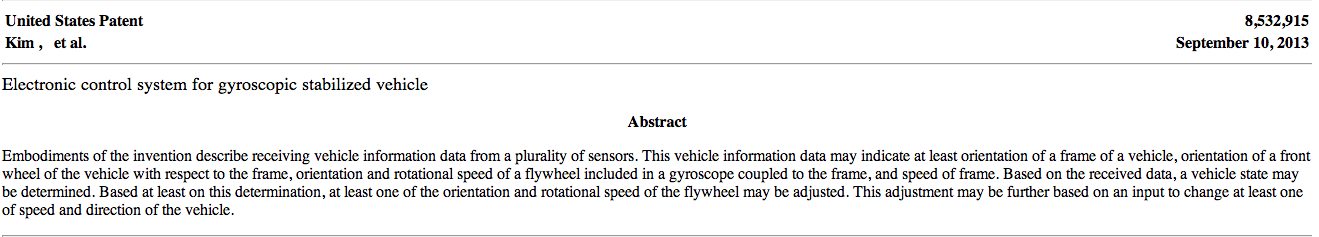
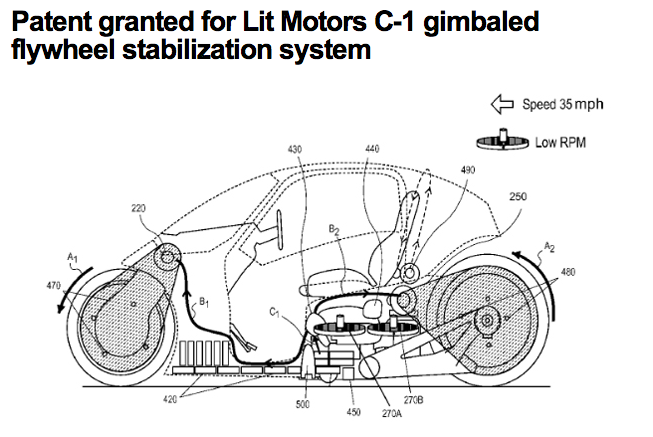
While an LAV might take any number of forms, this case study envisions a two wheeled vehicle combining in-line (motorcycle/bicycle) and parallel (Segway type) wheel layouts with the capability for seamless transition between both formats. There is nothing particularly radical in either configuration. Recent patents granted for gyroscopically stabilized two wheeled vehicles (LIT motors, see appendix 2) demonstrates the potential for stability for stationary two wheeled in-line vehicles, and the reliability of dynamically stabilized vehicles is demonstrated by the Segway. The illustration below demonstrates these two modes of operation. With wheels in parallel mode vehicles are oriented to pick up or drop off uniform containers. The in-line configuration allows vehicles move at high speeds in traffic lanes, on road margins, and in more constricted transport corridors.
There are significant advantages for smaller vehicles over more traditionally sized forms of transport. Most important is the potential to utilize existing infrastructure without significantly impacting present use. Autonomous operation is also critical to the adoption of electrical propulsion due to their ability to utilize even limited charging infrastructure effectively. Batteries can be the same configuration as cargo, to be swapped out quickly and easily.
Due to its small size an LAV would have access to areas normally reserved for pedestrians and bicycles, with pickup and dropoff points having a minimal footprint. The LAV operational profile would envision them using the left-hand side of the existing bike lanes as one of their primary pathways. This could serve the additional purpose of further delineating and protecting the bicycle path and its users. Further advantage derive from a reduced public perception of the danger of operating driverless vehicles on public roadways. Their small size and limited mass would allow an LAV to operate in close proximity to other road users in almost all existing infrastructure. It is important to keep in mind that these vehicles will have a superior ability to detect pedestrians and bicycles than human drivers and thus are unlikely to increase risks for non-motorized traffic. A similar response to congestion -- that of using small two wheeled vehicles for personal mobility -- can be observed in many third world urban centers.

System Description
Vehicles of such limited size and capacity are clearly only useful as part of a system that utilizes significant numbers of similar vehicles in a coordinated fashion. The optimal size of such a system is explored in the capacity section. How vehicles are coordinated - whether in a distributed fashion or centrally controlled - is an engineering problem not addressed here. But they are assumed to each possess highly functional sensors, navigation, and communication systems that support coordinated use.
Containers of standard size and composition are another foundation of such a system, being used for waste, recycling, and product delivery. The condition of containers (cleanliness, damage, etc) would be assessed at distribution/collection nodes with containers removed from circulation (for repair, cleaning, or replacement) as necessary. The system would allow a high degree of automation due to the standardization of containers and vehicles. Larger containers and vehicles would be used to bring goods to distribution nodes (and collect waste and recycling loads) in what would be a highly automated process.
Distribution nodes would be another component of a complex system of which the LAV would be only a part. Depending on the size (and population density) of an urban area multiple nodes of distribution and collection would be required. The size of each delivery area will largely rest on factors related to the development of a distribution system, or systems, that take advantage of automated delivery networks. The square mileage and radius of these areas are calculated using simple circular distribution center patterns, including a significant amount of overlap between distribution/collection areas. (for Seattle see above)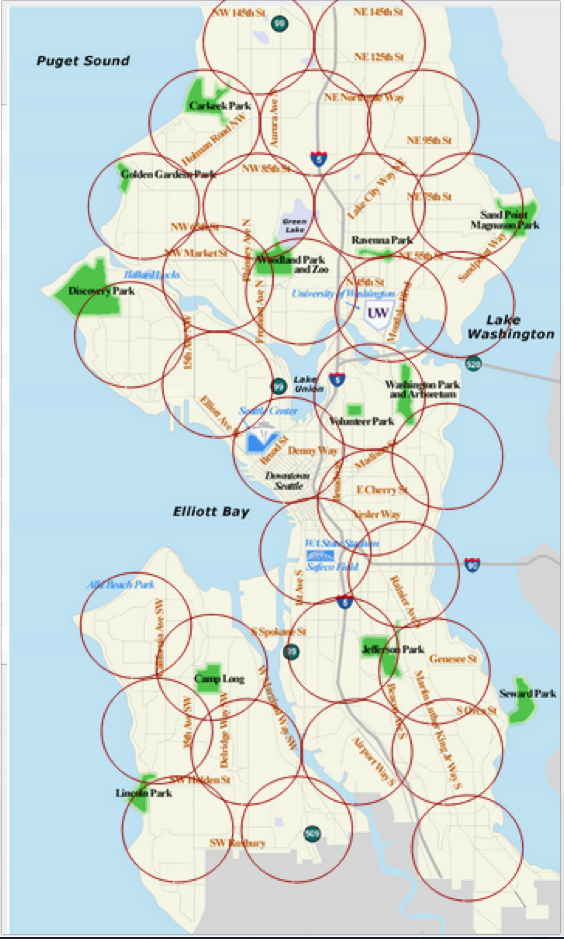
Applications
Municipal Solid Waste (MSW)
Solid waste disposal is among the oldest institutional challenge faced by cities and one of the most exciting opportunities to put this new technology to use. The challenge facing cities has always been the same, reuse what can be reused, dispose what cannot. Because of the growing volume of household waste and enormous capacity of truck based collection systems the emphasis has been on disposal. This has not always been the case.
Every morning millions of Americans are wakened by the sound of large diesel waste collection (and recycling) vehicles rumbling through their neighborhood. Municipal solid waste (MSW) is, after personal transportation and home heating, the largest sources greenhouse gas emissions in most urban areas (Chen 2008). The goal of this study is the potential for autonomous vehicles to address real world problems, and the collection of household waste and recycling is among the central tasks of municipal authorities. It is a highly visible function as well. This case study will quantify the potential for the smallest of autonomous vehicles to tackle the one of the largest urban transportation challenges.
Rather than accumulating household waste for weekly pick-up, the LAV based system would allow users to set out smaller loads on an on-demand basis. As the typical container would be no larger than a kitchen garbage can it is likely that waste and recycling would be set out daily, with speed of collection depending on system efficiency. This would make household waste management an ongoing task, but if it coincides with more frequent delivery of consumer goods (via the same network) the overall workload should be significantly diminished. Beside the reduction in noise from large, diesel powered collection vehicles the elimination of large waste storage bins (and the urban wildlife it attracts) would improve the look and smell of urban spaces.
By focusing on the potential of lightweight vehicles to address both delivery and collection roles we shed light on their close relationship between consumption and waste. After all, waste is the result of - and almost perfectly balanced by - consumption. Presently the two activities (product consumption/waste disposal) are performed by two almost entirely separate systems that share the same road. Using the same vehicles and infrastructure for both will be a powerful incentive for municipal governments to invest in such systems, or partner with private delivery services. In this case the LAV’s capacity for the collection of municipal solid waste is leveraged by their larger and more lucrative potential as delivery vehicles.
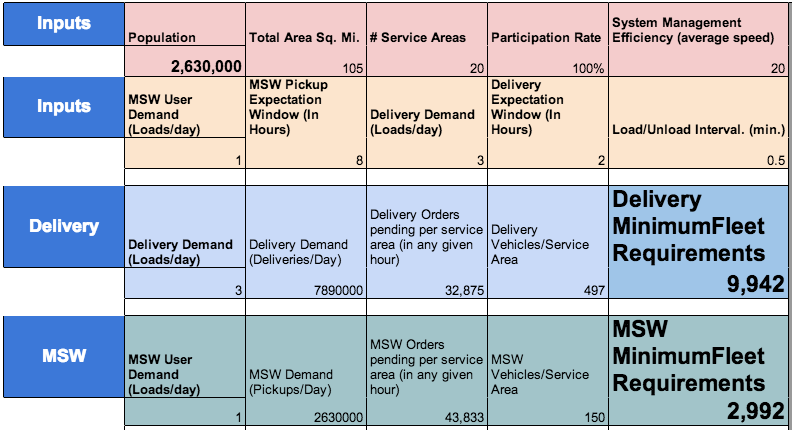
Example:Fleet requirements for waste collection in a Seattle size urban area.
Recycling
The increasing effectiveness of recycling programs, and their alternative to landfill as a waste disposal option, has resulted in real decreases in urban carbon emissions (Mühle et al. 2010). As the emissions associated with the materials collected are offset either by recycling, or used as an energy source in incineration, the significance of the collection and transportation of municipal waste becomes increasingly important (Gevaers et al).
The small loads that comprise a LAV based collection system can provide the foundation for a much more sophisticated recycling system. As long as recyclable objects fit into uniform containers there need be no outward differentiation between materials, but their destinations may be very different. Identification would be as easy as scanning a barcode on the side of the container and inputting content information (perhaps using a single keystroke) on a smartphone or other connected device. From there recyclables could be sent to facilities dedicated to their particular needs, as opposed to the mass processing facilities of today.
LAV based infrastructure provides an opportunity to implement alternative solutions using emerging technologies that are both more lightweight and less labor-intensive. The recycling and reuse components of solid waste provides perhaps the most significant opportunity for new transportation infrastructure to play a role in reducing greenhouse gas emissions, while at the same time supporting a more sustainable economic system. Under the existing paradigm increases in the number of categories of recyclable materials, and objects that might be reused, are beyond the capacity of large scale collection programs. Intrinsically valuable items that are present difficult for the waste management system to handle - i.e. used electronics and other inherently valuable consumer products - are potential targets for a more sophisticated collection system. The goal is a waste collection system that mirrors the complexity of the production and distribution networks already in place in the developed (and developing) world.
System Capacity
The simplest manner to estimate the size (ie the number of vehicles) of the system is based on the carrying capacity of the road net, and the speed at which individual vehicles can distribute loads, and the resulting gross tonnage of cargo moved per day. A conservative calculation (see appendix 2) suggests that a city the size of Seattle with 7,500 such vehicles (it could accommodate over 20,000) with a delivery (and pick-up) capacity of nearly one unit per resident per day. This assumes, however, that the vehicles would operate at no more than 30 mph, carry loads that were no more than 40% of capacity, with no signaling coordination at intersections, and with a massive operational friction coefficient of 70%. Based on the above calculation a fully optimized system of this size would be able to accommodate multiple deliveries/pick-ups for each resident every day.
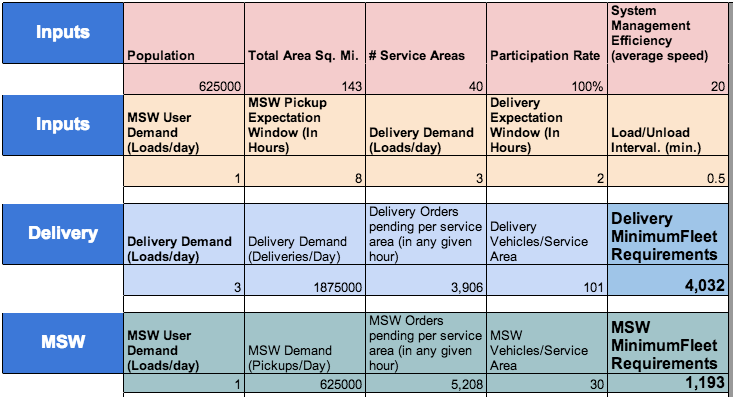
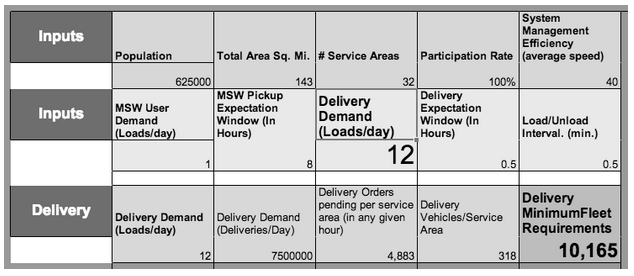
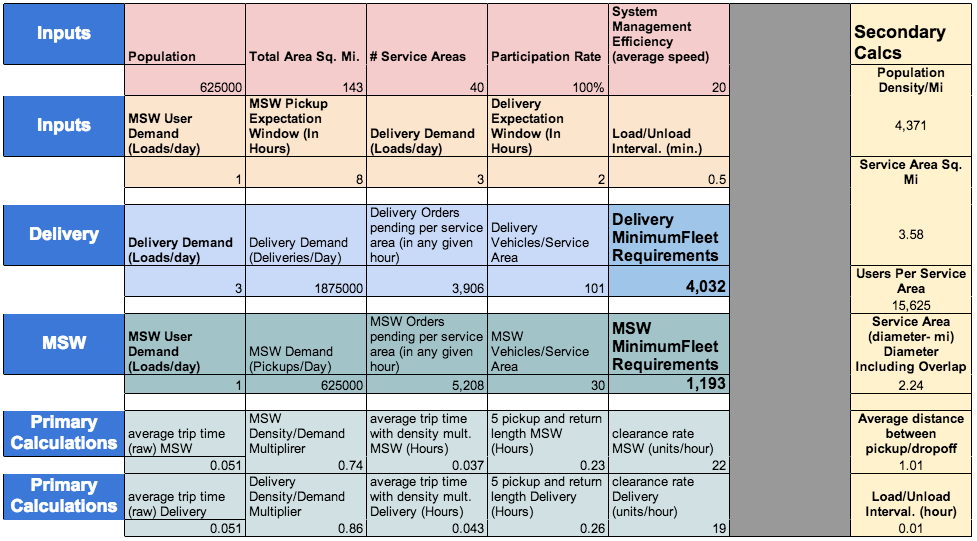
A more in-depth calculation depends on spatial analysis and demand models to arrive at minimum fleet requirements for specific needs. Fleet demand is calculated with the following inputs; city population, city size, number of delivery areas, participation rate, average LAV speed (system efficiency), user demand (both for delivery and pickup), and LAV turnaround time. Vehicle capacity, vehicle speed, and turnaround times drive a simple calculation of average trip times. A density/demand multiplier based on demand density and user expectations for delivery/pickup windows is applied to raw transit times to derive each vehicle’s clearance rate --the number of deliveries or pick-ups made per hour.
Example: Delivery and Waste collection Fleet Requirements for Seattle
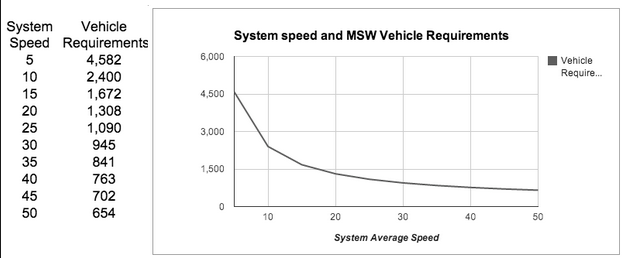
Critical to the calculation of capacity is the clearance rate for unit collection/delivery. This clearance rate is based on the service area size, the speed at which vehicles will operate in the urban space, and the average turnaround time for the pick up of packages at the point of origin or destination. Of these factors the speed of the vehicles is critical, and derives primarily from their ability to move smoothly through existing infrastructure. This value is largely dependant on increasing infrastructure efficiency due to vehicle automation. Therefore, not only the capabilities of autonomous vehicles individually, but the operation of the system as a whole, will directly impact on the number of vehicles required to accommodate collection/distribution requirements.
At present most vehicles in an urban setting have a maximum speed of around 45 miles an hour, but with an average speed of significantly less than 20 miles an hour. It is possible to envision lightweight vehicles moving in an urban landscape -- with coordinated signaling and dedicated right of ways -- at average speeds of 30 or even 40 miles an hour. This alone would double the capacity of the system.
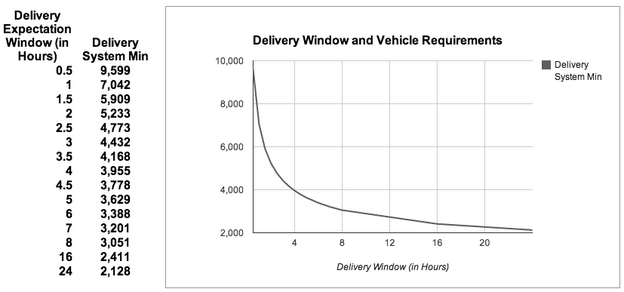
The delivery system will be also depend on users expectation of timeliness and frequency of service. Depending on the time window for delivery, a system with all other variables held constant will require dramatically different numbers of vehicles to sustain expected capacity. The chart below describes the vehicles required for delivery windows between one half and 24 hours. Sensitivity is greatest below four hours, with delivery expectation less than one hour dramatically raising the requirements for fleet size.
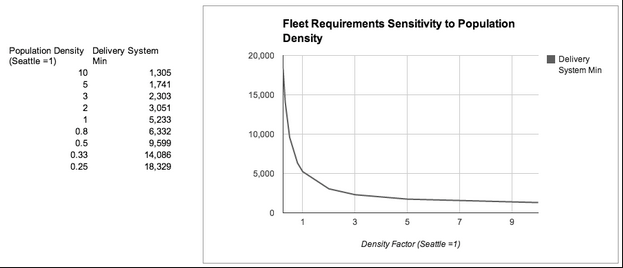
Population density is also critical for the effective use of available vehicles. The chart and graph below shows that densities that are less than typical for urban areas dramatically increase the number of vehicles required to accommodate demand expectations. Rural areas are likely to require as much as three or four times the number of vehicles for comparable levels of service. Densities greater than most western cities, typical of built-up urban centers such as New York and Shanghai, only marginally improve the required ratio of vehicle to users.
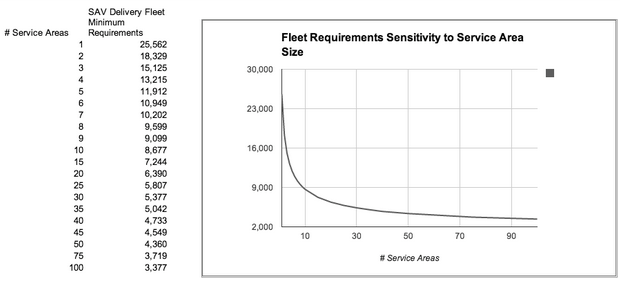
The final sensitivity analysis is done in respect to the service area size. This related to, but not the same as, density considerations. Because each service node implies a significant amount of supporting infrastructure, and therefore cost, determining optimal network configuration is important. The chart below clearly indicates that urban areas would be poorly served by a distribution network with few nodes. In the example of Seattle, fleet size requirements requirements increases sharply with fewer than 15 service areas (@ 10 mi² each). Above 40 service areas(About 4 mi.² each) there is little further advantage.
Taking together the optimum fleet size for a city such as Seattle hovers around the 5000 vehicle mark. This suggests that a substantial amount of home delivery could be accommodated with one vehicle for every 125 active users.
Even under conditions of extreme demand, as described the chart below, there would be a requirement of up to one vehicle for every 60 active users. This is a situation where users are relying on the delivery system for a significant portion of meals, all small item delivery, and potentially even for subscription services associated with apparel and housewares. However, a fleet size of this magnitude would constitute significant addition to roadway traffic and would have to be balanced by a reduction in numbers of existing delivery and collection vehicles.
As both methods of calculating the capacity of delivery system based on LAVs demonstrate, the sheer number of deliveries that could be made by such a system is enormous. The environmental costs of operating such a large number of vehicles 24 hours a day is the subject of the next section. It is important to keep in mind that these are small, lightweight electric vehicles as opposed to the large diesel and gasoline powered delivery collection vehicles in use today. Is also potentially significant that the deliveries made by LAVs replace many single occupancy vehicle trips for shopping and other errands. It would create a potential for a much more flexible response to the transportation needs of urban populations, either as an adjunct to more traditional mass transit modes or other options enabled by driverless vehicles.
Sustainability
Taipei Case Study
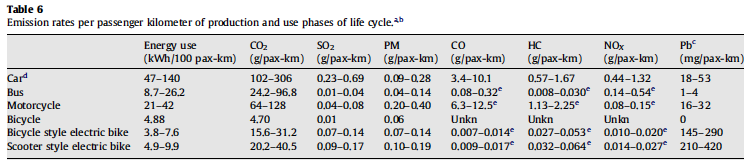
Having explored the systems potential capacity and examined some of its potential applications, it is helpful to measure its impact in terms of sustainability. There is significant potential for induced demand due to increased capacity, and to get a measure of the system's overall sustainability is critical. As there has been no comprehensive study of the environmental costs of an LAV (they do not, after all, exist) it's necessary to look for an appropriate substitute that has similar characteristics. Fortunately a significant amount of research has been directed towards the environmental costs of the dramatically increasing usage of electric bicycles and motorcycles in China. With similar size and weight characteristics, and with loads that are roughly equivalent, it is a rough but ready comparison (see appendix 4). Using this as a starting point a thumbnail analysis can be made of what environmental costs might be incurred by a large fleet of LAVs. This, combined with a study done on the transportation costs of MSW pick up in Taipei, provides rough comparison of the environmental impacts of the proposed and existing solid waste collection systems .
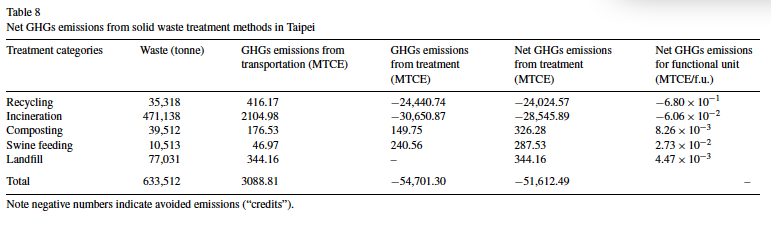
Taipei itself has nearly 4 times the population of Seattle in a significantly smaller area. Due to its density the resulting fleet requirements are only about twice as great as those of Seattle. The system is assumed to make full use of, and even facilitate greater complexity in the recycling process. This reflects the situation in Taipei (diagram below) where there is significant effort devoted to reducing overall waste related GHGs through recycling and waste energy generation. Overall GHG emissions by the municipality's nearly 500 waste and recycling trucks is estimated at 3088 MTCE/year. (Metric Tons Carbon Equivalent)
It is significant that the net GHG emissions associated with recycling actually reduce the overall emissions associated with waste disposal. The greater flexibility associated with small,
high-frequency pickups should allow for an even greater portion of remaining solid waste to be diverted into the recycling stream.
LAV fleet emissions are calculated based on the cumulative mileage associated with MSW demand. On a yearly basis this would amount to (2.36mil x .018m/trip x 365) or over 15 million miles/year for the entire fleet of LAVs. Assuming that GHG generation for each LAV is roughly equivalent to a lightweight, scooter size electric vehicle (.6 g/mi. run primarily on coal generated electricity) the overall fleet output is 1,025 MTCE/year.
The result is approximately one third of the emissions associated with the traditional diesel/gasoline powered collection vehicles. Even under conditions where electric generation results in high emissions due to coal-fired electricity generation, small electric vehicles result in fewer health impacts. In areas where electricity generation is generally cleaner, such as Seattle, electric vehicles, especially lightweight ones, are even more attractive vis-à-vis gasoline powered or diesel powered vehicles. However, a more in-depth study of the lifecycle costs associated with battery-powered vehicles of this type is clearly called for.
LIMITATIONS/FUTURE WORK
The primary limitation of this paper the highly conceptual and speculative nature of the subject. While many are convinced that driverless vehicles are on the verge of viability, it will be several years before the magnitude of the change become apparent. Even then, there will be difficulty in finding a firm empirical basis for speculation about the potential of a transportation system based on computer algorithms rather than human behavior.
With this in mind two themes closely related to sustainability goals that appear to be likely areas of future study;
Transit
Transit offers a unique opportunity as well as a unique challenge when considering the potential for autonomous vehicles. It is also likely to be among the first institutions dramatically affected by this new technology. According to CUTR (Center for Urban Transportation Research) Executive Director Jason Bittner: “Transit as we know it—large buses serving dense corridors with little flexibility—is unlikely to exist in 20 years. Public transportation operators should seriously consider the business model that an automated fleet of smaller vehicles would provide.”
Unlike single occupancy vehicles, public transit systems play a broader societal role in providing equal access to mobility. It seems unlikely that driverless vehicles will lead to a perfectly equitable access to personal transportation, and there be a continuing public role in addressing these inequalities. Straightforward calculations of the cost reductions associated with labor in the transit system should be possible. Recent trends toward increasingly large transit vehicles largely result from increasing labor costs, and smaller vehicles might provide an opportunity for flexibility and convenience of service unobtainable with existing transit vehicles.
Systems based on driverless vehicles may result in unique opportunities for pursuing sustainable goals without some of the drawbacks of the present transit system. According to autonomous car researcher Alain L. Kornhauser of Princeton University: “SAV network also has the potential to enhance transit ridership on existing commuter routes. After all, a convenient ride to and from the station could increase demand enough for transit agencies to run even more trains or buses. That doesn't solve the problems of funding low-demand transit corridors, but it does reduce the scale of the investment.”
CONCLUSION
It is important to explore ways in which new technology interacts with existing transportation infrastructure. As the transportation community becomes reconciled with the fact that a long promise technology is rapidly becoming a reality, it is necessary to examine its potential in the context of today's connected world. The growing potential of the internet, and its power to coordinate activities both the virtual and real world, dramatically surpasses even recent visions of the far future. In this context it becomes important to look beyond the limitations that the human driver places upon vehicle size, shape, and function.
It is not surprising that we find it difficult, almost impossible, to see beyond the world the car and driver has created. We cannot see the implications of a personal transportation system that doesn't rely on us “riding along”. This is a powerful emotional blind spot that colours our every attempt to envision a driverless future.
There is little danger of overestimating the magnitude this change is likely to make. We are replacing the communications, navigation, and control systems of the most highly developed and complex transportation infrastructure ever created. Perhaps the only apt historical analogy is the replacement of muscle power (the horse) with chemical power (the internal combustion engine). While we may be better equipped to look into this future, we certainly must make better use of the positive potential of this technological change.
Bibliography
Ballantyne, K. et al., Toward a Systematic Approach to the Design and Evaluation of Automated Mobility-on-Demand Systems : A Case Study in Singapore The MIT Faculty has made this article openly available . Please share Citation Accessed Citable Link Detailed Terms Toward a Syst. , pp.0–16.
Chen, T.-C. & Lin, C.-F., 2008. Greenhouse gases emissions from waste management practices using Life Cycle Inventory model. Journal of hazardous materials, 155(1-2), pp.23–31. Available at: http://www.ncbi.nlm.nih.gov/pubmed/18164811 [Accessed November 30, 2013].
Chen, Z., 2013. 95 Cathy Macharis and Sandra Melo, eds. 2011. , pp.2011–2014.
Cherry, C.R., 2003. No Title.
Cherry, C.R., Weinert, J.X. & Xinmiao, Y., 2009. Comparative environmental impacts of electric bikes in China. Transportation Research Part D: Transport and Environment, 14(5), pp.281–290. Available at: http://linkinghub.elsevier.com/retrieve/pii/S1361920908001387 [Accessed November 13, 2013].
Eisenberg, M.S. et al., 1990. Cardiac arrest and resuscitation: a tale of 29 cities. Annals of emergency medicine, 19(2), pp.179–86. Available at: http://www.ncbi.nlm.nih.gov/pubmed/2301797.
Fagnant, D., Hall, C.J. & Kockelman, K.M., 2014. To be presented at the 93rd Annual Meeting of the Transportation Research Board in Washington DC, January 2014, and under review for publication in. , pp.1–22.
Gevaers, R. et al., Cost modelling and simulation of B2C last-mile characteristics with implications on urban areas and cities.
Hahn, P., 2012. Seattle Department of Transportation. , (206), pp.27–81.
Hoogendoorn, R., Arem, B. Van & Hoogendoorn, S., 2014. Automated Driving , Traffic Flow Efficiency And Human Factors : A Literature Review. , pp.1–18.
Hoornweg, D., Sugar, L. & Trejos Gomez, C.L., 2011. Cities and greenhouse gas emissions: moving forward. Environment and Urbanization, 23(1), pp.207–227. Available at: http://eau.sagepub.com/cgi/doi/10.1177/0956247810392270 [Accessed November 6, 2013].
Ji, S. et al., 2012. Electric vehicles in China: emissions and health impacts. Environmental science & technology, 46(4), pp.2018–24. Available at: http://www.ncbi.nlm.nih.gov/pubmed/22201325.
Jordan, W.C. & Llc, J.A., Lawrence D . Burns , Director , Program on Sustainable Mobility The Earth Institute , Columbia University.
Julia B. Edwards, Alan C. McKinnon, Sharon L. Cullinane, (2010) “Comparative analysis of the carbon footprints of conventional and online retailing: A ”last mile“ perspective”, International Journal of Physical Distribution & Logistics Management, Vol. 40, pp. 10.-123, No Title.
Karch, S.B. et al., 1998. Response times and outcomes for cardiac arrests in las vegas casinos. The American Journal of Emergency Medicine, 16(3), pp.249–253. Available at: http://www.sciencedirect.com/science/article/pii/S0735675798900948.
Mühle, S., Balsam, I. & Cheeseman, C.R., 2010. Comparison of carbon emissions associated with municipal solid waste management in Germany and the UK. Resources, Conservation and Recycling, 54(11), pp.793–801. Available at: http://linkinghub.elsevier.com/retrieve/pii/S0921344909002882 [Accessed November 30, 2013].
Sovacool, B.K. & Brown, M. a., 2010. Twelve metropolitan carbon footprints: A preliminary comparative global assessment. Energy Policy, 38(9), pp.4856–4869. Available at: http://linkinghub.elsevier.com/retrieve/pii/S0301421509007277 [Accessed November 8, 2013].
States, T.U., National Highway Traffic Safety Administration Preliminary Statement of Policy Concerning Automated Vehicles.
Time, R., Response Time Effectiveness : Comparison of Response. , pp.288–295.
White, R.D., Vukov, L.F. & Bugliosi, T.F., 1994. Early defibrillation by police: initial experience with measurement of critical time intervals and patient outcome. Annals of emergency medicine, 23(5), pp.1009–13. Available at: http://www.ncbi.nlm.nih.gov/pubmed/8185091.
Appendix 1
Gyroscopically Balanced Two Wheeled Vehicle Patent; Lit Motors
Appendix 2
- Maximum vehicle capacity: 5 x 50 lb. cargo units = 250 lb.
- Average load of assumed to be 40% capacity -- 2 of 5 units -- @ 100lbs.
- 3 second headway per vehicle at average speed of 30 mph. (1200 vehicle per hour, one vehicle per @135ft)
- Intersections capacity 50%
- Operational friction capacity 70%
- Arterial one way vehicle capacity: 1200 x .5 x .7 = 420 vehicles per hour ( @840 cargo units or 42,000 lbs-21 tonnes)
- Arterial per mile capacity; @15vehicles/mile (including friction and intersection limitations) 15 x 100 lb = 1500 lb.(.75 tonnes/arterial mi)
Assumptions;
- 1530 lane-miles arterial in Seattle (Seattle DOT)
- 7,500 (SAV) vehicles operational (33% maximum road capacity)
- average clearing of loads every 20 minutes (3x per hour)
Calculations;
.75 tonnes/mile (See Load Calc)
x 1530 arterial miles
x 3 loads/hour
x 33% capacity
= 1,130 tonnes/hr (@27,000 tons/24hr)
= 540,000 units/loads per day
Appendix 3
Spreadsheet detailing fleet requirements for Seattle.
Appendix 4
Spreadsheet detailing fleet requirements for Taipei.
Lars Christian
University Washington
Sustainable Transportation Program
Department of Civil and Environmental Engineering
201 More Hall, Box 352700
Seattle, WA 98195-2700
Key Words: Autonomous vehicles, driverless cars, safety, congestion, LAV, autonomous transit, lightweight autonomous roadway system


Comments
Post a Comment